


Heat Pump Statistics

Current regulations, as part of their efforts to promote renewable energy, require the different renewable energy sources to be classified according to their origin in order to assess their relevance.
Regulation (EU) 2024/573 of 7 February 2024 on fluorinated greenhouse gases (F-gases) defines a heat pump as “a piece of equipment capable of using ambient heat or waste heat from air, water or ground sources to provide heating or cooling, and which is based on the interconnection of one or more components forming a closed refrigeration circuit in which a refrigerant circulates to extract and release heat.”
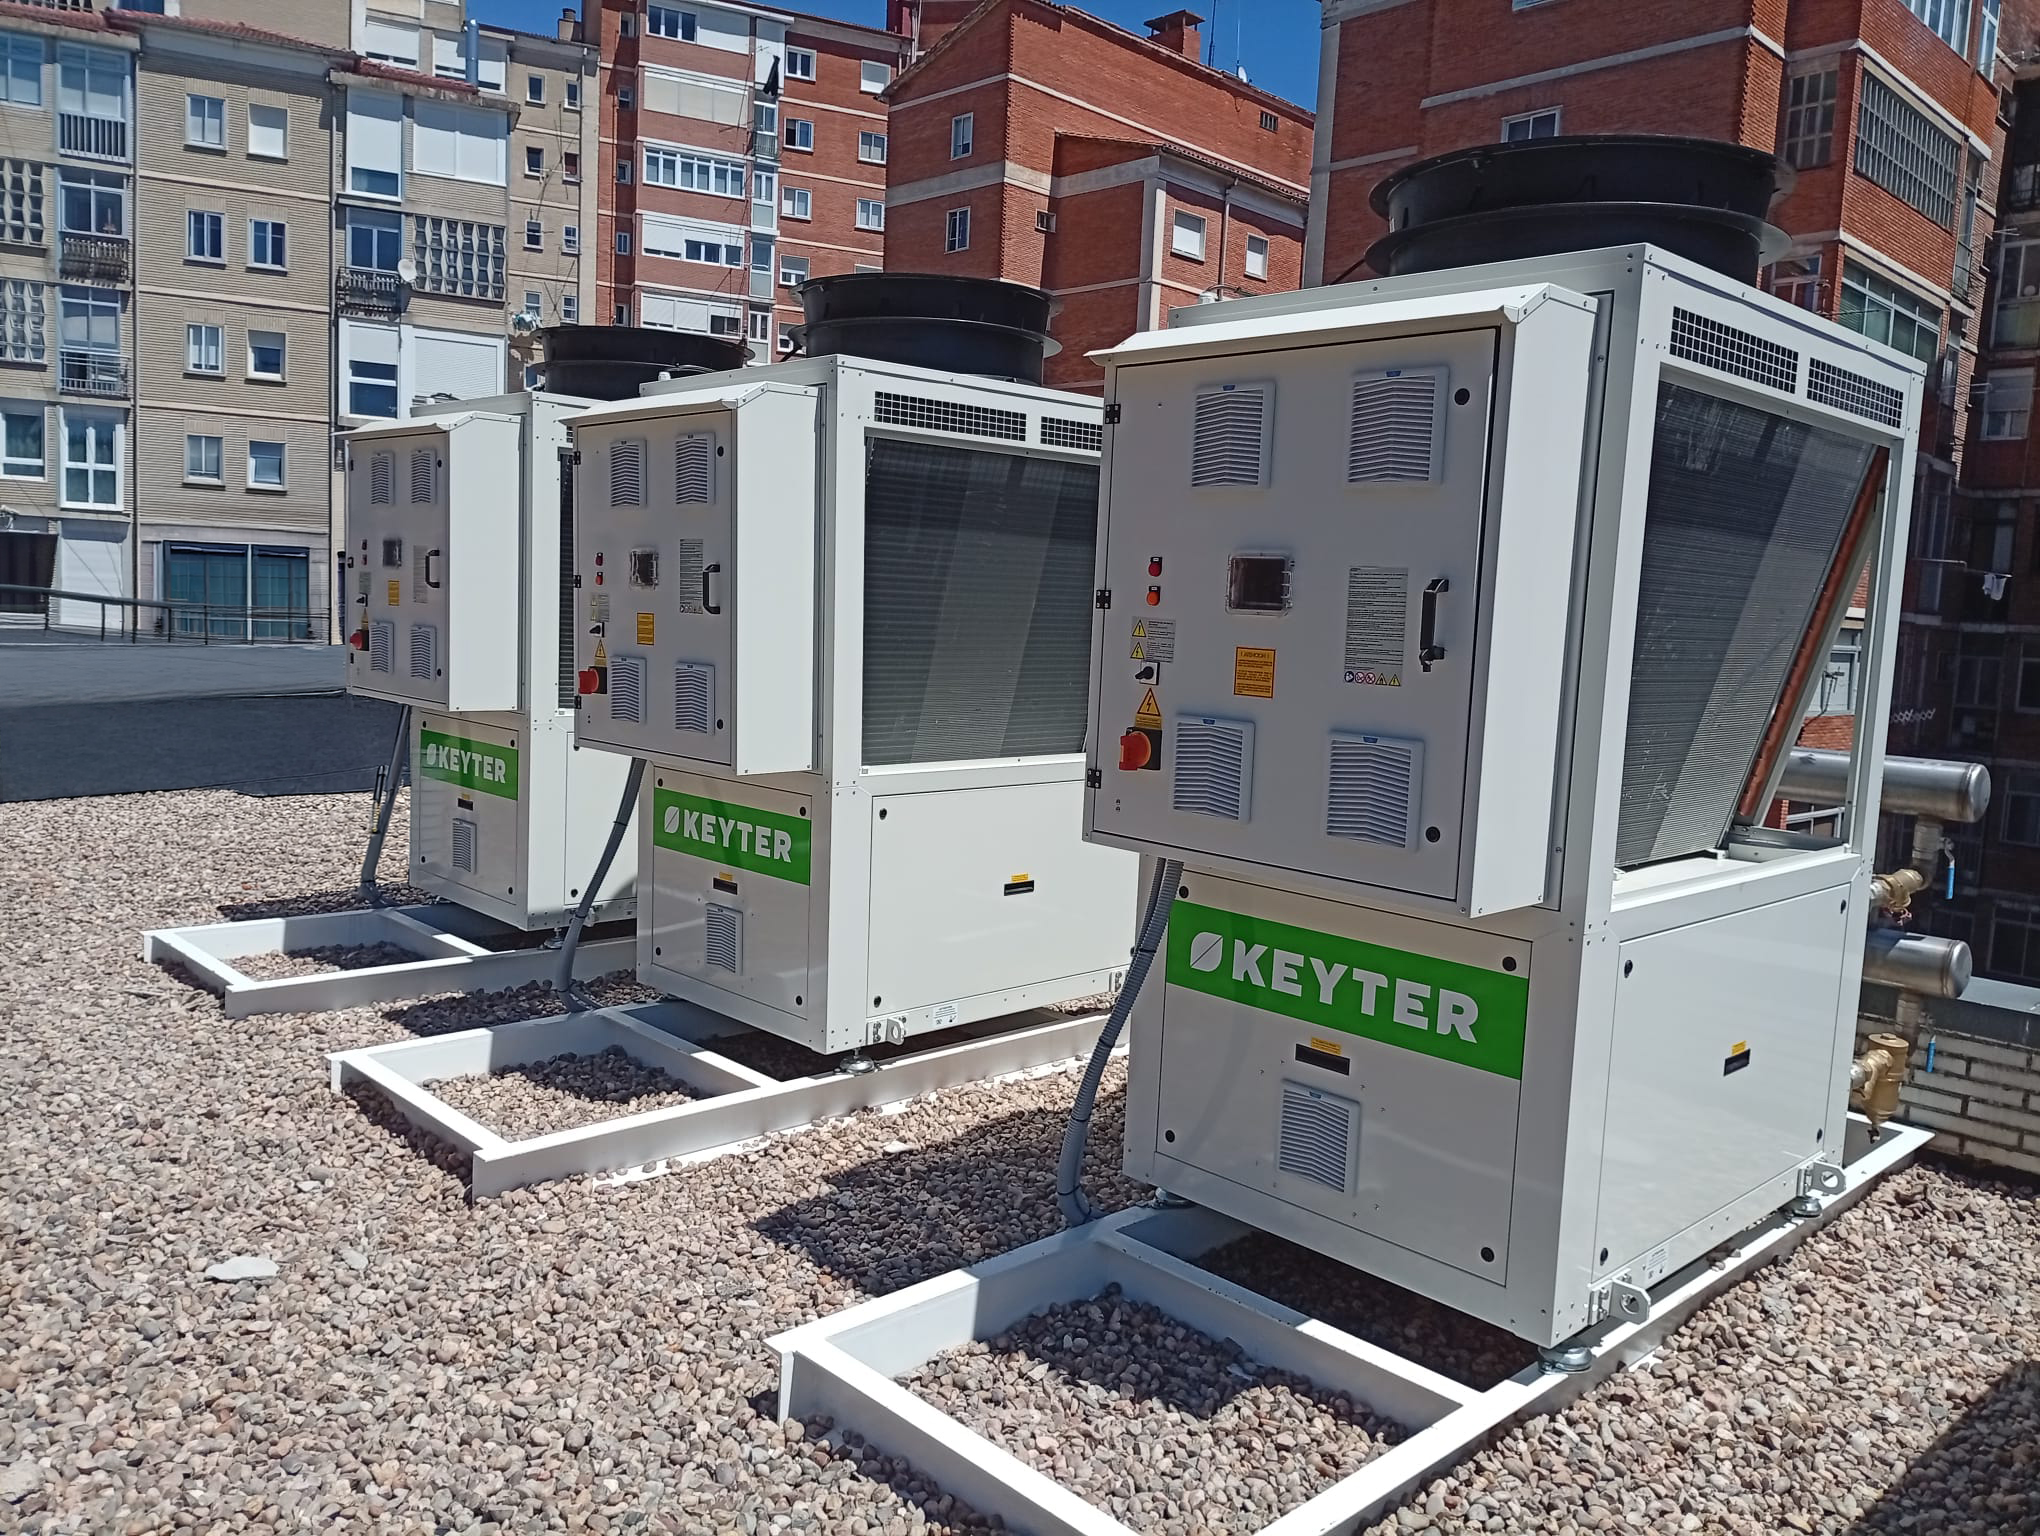
A more in-depth analysis of the equipment’s operation shows that, when operating in cooling mode, the heat pump can provide cooling to a space while simultaneously recovering the heat released during condensation to produce Domestic Hot Water (DHW). As a result, in certain units—depending on their design—1 kWh of final electrical energy at the point of consumption can produce more than 2.5 kWh of thermal energy, owing to the renewable contribution of aerothermal energy.
On the other hand, due to the non-renewable components of the current energy mix, approximately 2.5 kWh of primary thermal energy—obtained through the combustion of natural gas or another generation method—is required to produce 1 kWh of final electrical energy.
This criterion depends on how energy—in this case, electricity—is generated and transported from the point of production to the point of consumption. Its value varies as the energy system evolves. In fact, the previously assigned value of 2.5, corresponding to the final-to-primary energy conversion factor, is expected to be revised shortly.
In May 2026, MITECO launched a public consultation on the document entitled “PROPOSAL FOR CONVERSION FACTORS BETWEEN PRIMARY AND FINAL ENERGY AND EMISSIONS”, according to which the new conversion and emission factors will be as follows:
| Approved values | |||||
|---|---|---|---|---|---|
|
kWh primary energy / kWh final energy |
kg CO2e / kWh final energy |
||||
| Energy carrier | Fp;nren | Fp;ren | Fp;tot | KCO2e | |
| Fossil fuels | Heating oil | 1.1 | 0 | 1.1 | 0.29 |
| LPG | 1.1 | 0 | 1.1 | 0.22 | |
| Natural gas | 1.1 | 0 | 1.1 | 0.22 | |
| Coal | 1.1 | 0 | 1.1 | 0.36 | |
| Electricity (GRID) | National | 0.11 | 1.19 | 1.3 | 0.025 |
| On-site renewable energy | Solar photovoltaic | 0 | 1 | 1 | 0 |
| Solar thermal | 0 | 1 | 1 | 0 | |
| Wind | 0 | 1 | 1 | 0 | |
| Hydropower | 0 | 1 | 1 | 0 | |
| Ambient energy | 0 | 1 | 1 | 0 | |
| Biomass | 0.2 | 1 | 1.2 | 0.04 | |
| Biogas | 0.4 | 1 | 1.4 | 0.1 | |
| Biofuels | 0.5 | 1 | 1.5 | 0.07 | |
| Heating and/or cooling networks* | – | – | – | – | |
| Export |
Electricity exported to the grid by a building |
0.1 | 0.9 | 1 | 0.019 |
Table 1: Proposed national values for primary energy conversion and emission factors
Source: MITECO
It is particularly noteworthy that the current value of 2.5 will soon be reduced to 1.3.
Therefore, the equipment must deliver more energy than was consumed to produce the electricity it uses. This is the basis for the Seasonal Performance Factor (SPF), which assigns a numerical value to the energy delivered by the unit. It also led Directive 2009/28/EC to establish that a heat pump is considered partially renewable when, under Directive (EU) 2018/2001, SPF > 1.15/η, where η is the average efficiency factor of electricity generation, i.e. the ratio of gross electricity production to the primary energy used to generate that electricity, calculated as a European Union average using Eurostat data.
Where:
SPF, SCOP and COP should be distinguished: COP is an instantaneous performance indicator; SCOP is a standardized seasonal performance indicator; and SPF, in the context of renewable-energy accounting, is used to determine the renewable contribution of a heat pump. A unit’s declared SCOP should therefore not automatically be treated as equivalent to the actual SPF of an installation.
The SPF value prompted the creation of heat-pump statistics through collaboration between the Institute for Energy Diversification and Saving (IDAE) and the Spanish Association of Air-Conditioning Equipment Manufacturers (AFEC). Together, these institutions conducted a study of heat pumps that meet the renewable-energy criterion and were installed from 2014, the first year studied, through 2024, the latest year currently available.
The statistics compile sales-based data for aerothermal heat pumps and census data for geothermal and hydrothermal heat pumps, owing to their lower penetration in the Spanish market. In fact, 99.9% of the equipment analyzed in every available year consists of aerothermal heat pumps. The remainder of the article therefore focuses on this specific equipment type, whose average SPF over the study is 3. Since the exact value could not be obtained, the following formula based on the heating-mode coefficient of performance (COP) was used:
Where:
FP: Weighting factor that accounts for Spain's climate zones under the Technical Building Code (CTE). The following table shows the applicable values by heat-pump heat source and climate zone (A, B, C, D and E):
| Heat-pump heat source | A | B | C | D | E |
|---|---|---|---|---|---|
| Aerothermal - Centralized systems | 0.87 | 0.80 | 0.80 | 0.75 | 0.75 |
| Aerothermal - Individual split-type systems | 0.66 | 0.68 | 0.68 | 0.64 | 0.64 |
| Hydrothermal | 0.99 | 0.96 | 0.92 | 0.86 | 0.80 |
| Closed-loop geothermal - Horizontal heat exchangers | 1.05 | 1.01 | 0.97 | 0.90 | 0.85 |
| Closed-loop geothermal - Vertical heat exchangers | 1.24 | 1.23 | 1.18 | 1.11 | 1.03 |
| Open-loop geothermal | 1.31 | 1.30 | 1.23 | 1.17 | 1.09 |
The applicable climate zone is referenced to the provincial capital and its elevation above sea level. The climate-zone table is available in Annex B of the Basic Document HE, Energy Saving:
FC: Correction factor for the operating temperature relative to the test temperature. This factor is not considered in the study, so its value is 1 in all cases.
The aerothermal heat pumps studied are classified by heat source and distribution medium as air-to-water, air-to-air and water-to-water; air-to-water units may be reversible or non-reversible. Air-to-air overwhelmingly predominates, accounting for more than 98%, although a slight increase in air-to-water systems has been observed. Non-reversible air-to-water systems have an almost negligible share.
For clarity, a reversible unit can operate in both heating and cooling modes; a non-reversible unit can operate in only one of these modes. In the terms air-to-water and water-to-water, the first term denotes the heat source and the second the medium to which heat is transferred. In the first case the source is air; in the second, water.
For a more detailed analysis, the data are divided into the sectors shown in the following diagram:
GROUPING
Energy sector
Industry sector
- Capital goods
- Wood and wood products
- Non-ferrous metallurgy
- Food, beverages and tobacco
- Construction
- Paper and printing
- Iron and steel and foundries
- Other industries
Transport sector
Other uses
- Public administrations
- Education
- Residential
- Agriculture
- Commerce
- Hospitals
- Restaurants
- Hotels
- Offices
- Other services
- Public services
- Other unspecified activities
The data show that the residential sector predominates, accounting for more than 70% throughout the study. Its share has nevertheless fallen considerably over the years, from 86.2% to 75.7%. This decline is due to the increase in Other Unspecified Activities. Industry ranks next and is more stable, remaining between 8% and 9%.
Finally, the data can be divided by SHARES climate zones. This division is similar to the climate-zone classification used for ecodesign calculations such as SEER and SCOP (seasonal performance values), although the two methodologies serve different purposes. It comprises three zones: warmer, average and colder. Spain has only two of these zones, warmer and average, and the following map shows the classification for each province:
Average
climate
- Burgos
- Huesca
- La Rioja
- León
- Navarra
- Palencia
- Salamanca
- Segovia
- Soria
- Teruel
- Valladolid
- Zamora
- Zaragoza
Warmer
climate
- Albacete
- Alicante
- Almería
- Badajoz
- Baleares
- Barcelona
- Cáceres
- Cádiz
- Castellón
- Ceuta
- Ciudad Real
- Córdoba
- Cuenca
- Gerona
- Granada
- Guadalajara
- Huelva
- Jaén
- Las Palmas
- Lérida
- Madrid
- Málaga
- Melilla
- Murcia
- Orense
- Sevilla
- Tarragona
- Tenerife
- Toledo
- Valencia
The use of heat pumps in average climates shows an upward trend, increasing from 3.2% in 2014 to 19.1% in 2022.
Climate zones can also be classified as Atlantic-North, continental or Mediterranean. This is known as the SES classification. Data broken down using this climate classification are available in the document “Summary of the Study of the Heat Pump Stock in Spain” for 2014, which prevents year-on-year comparison. Nevertheless, it distinguishes households and establishments with heat pumps from the heat-pump stock and identifies the sectors in which they predominate, which is useful.
For households and establishments, most heat pumps are located in the Mediterranean zone, which has the greatest share in every sector:
| Climate zone | Population | Households | Commerce / services |
Industry | Transport-related activities |
Total |
|---|---|---|---|---|---|---|
|
Atlantic- North |
Total population | 2,373,620 | 336,070 | 91,835 | 3,774 | 2,805,299 |
| With heat pumps | 84,973 | 70,764 | 22,225 | 845 | 178,807 | |
| Continental | Total population | 6,077,563 | 894,899 | 237,626 | 8,281 | 7,218,369 |
| With heat pumps | 1,065,258 | 275,698 | 84,271 | 3,034 | 1,428,261 | |
| Mediterranean | Total population | 9,632,509 | 1,440,030 | 341,394 | 15,810 | 11,429,743 |
| With heat pumps | 4,620,756 | 901,624 | 213,290 | 11,262 | 5,746,932 | |
| Total | 18,083,692 | 2,670,999 | 670,855 | 27,865 | 21,453,411 | |
| Population with heat pumps | 5,770,987 | 1,248,087 | 319,786 | 15,141 | 7,354,001 | |
For the heat-pump stock, the continental climate has the largest number of units.
| Climate zone | Households | Commerce / services |
Industry | Transport-related activities |
Total |
|---|---|---|---|---|---|
| Atlantic-North | 244,599 | 459,640 | 136,380 | 10,714 | 851,333 |
| Continental | 4,806,706 | 702,299 | 193,124 | 11,645 | 5,713,774 |
| Mediterranean | 3,479,980 | 1,177,671 | 720,979 | 28,086 | 5,406,716 |
| Total | 8,531,285 | 2,339,610 | 1,050,483 | 50,445 | 11,971,823 |
This can be explained by the fact that most households using the technology are located in that zone. In contrast, the Mediterranean climate leads in commerce and services, industry and transport.
Where were the data used to compile these statistics obtained?
The data for this study are obtained from IDAE’s “Study of the Heat Pump Stock in Spain 2014,” which provides data on installed stock and capacity, operating hours, SPF, and thermal and renewable energy for each heat-pump type, sector, SES climate zone and capacity range.
Data are also obtained from AFEC market statistics, which provide the number of units sold, the average rated capacity of the units sold and the average SPF of the units sold for each heat-pump type, sector and autonomous community.
These two reports provide the inputs required for the RENAERO tool – a spreadsheet – to estimate renewable energy in heating mode.
The following diagram illustrates how the tool works:
The appendices to the statistical manual contain the templates for the various questionnaires used to collect the data: first, the model for residential households; second, the model for industry, transport, large-scale commerce and services; and finally, the Bdfer information-exchange questionnaire, the database of renewable-energy installations.
Regarding subsequent years, as noted above, no statistical data are available from 2024 onward. Nevertheless, since then manufacturers have increasingly incorporated heat pumps in the following sectors:
- Agriculture: Product processing and preservation.
- Livestock farming: Climate control for livestock buildings.
- Greenhouses: Maintaining optimum conditions for crop growth and food production.
KEYTER is firmly committed to this technology because of its partially renewable nature and its strong performance in providing climate control for different types of spaces in locations with diverse climates.
For more information, visit: https://estadisticas-bombasdecalor.idae.es/

Mari Ángeles Cepillo García
Industrial Technologies Engineer · Energy specialization · Researcher in IAQ and HVAC
University Expert in Air-Conditioning Systems. Engineering Department at KEYTER.
More articles
Interested in other (technical) knowledge articles? Keep yourself up to date and read them all
