


Calculation of SEER and SCOP for Variable-Capacity Equipment

Seasonal performance values – SEER (Seasonal Energy Efficiency Ratio) in cooling mode and SCOP (Seasonal Coefficient of Performance) in heating mode – provide a more realistic indication of equipment performance because they account for different operating and part-load conditions, as well as the operating hours associated with each reference climate condition, rather than considering only a single set of design conditions. The higher the SEER or SCOP value, the more energy-efficient the equipment.
UNE-EN 14825 specifies the conditions and procedures required to obtain these values, which are summarized throughout this article.
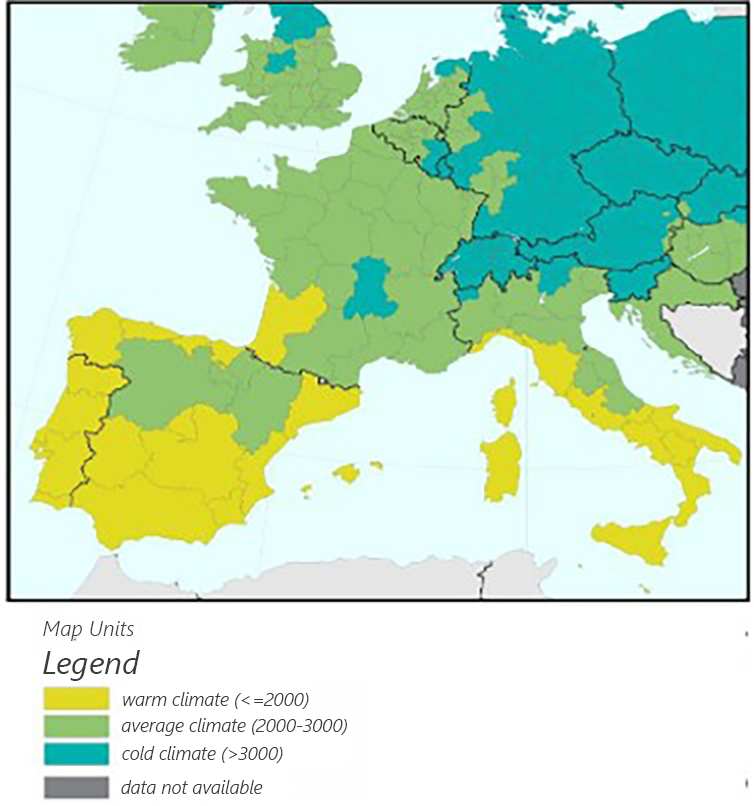
Before starting the calculations, the three defined climate zones must be established: colder, warmer and average. For heating conditions, the average season uses a statistical climate profile for Strasbourg as its reference. On the following map of Europe, the warmer zone is shown in yellow, the average zone in green and the colder zone in blue:
Cooling mode
For cooling mode, SEER is calculated using the procedure shown in the following diagram:
The numbers indicate the sequence to be followed when calculating SEER.
For this calculation, a single climate zone is defined, referred to as the average climate zone. This differs from heating mode, which considers all three climate zones so that the appropriate values can be applied according to the location where the equipment will be used.
The following equations apply to each step in the diagram. The corresponding terms are defined below each equation:
The unit ratings provide the power values, while the operating hours are obtained from the following table in the standard:
| Cooling mode hours |
Average climate (hours) |
|---|---|
| HCE | 600 |
| HTO | 659 |
| HSB | 1377 |
| HCK | 2036 |
| HOFF | 0 |
As shown, several capacity and power values are required by the equations at specific temperatures. Therefore, for variable-capacity equipment, the calculation requires the available capacity and power input at different operating conditions. When intermediate values between the available data points are required, they may be obtained using the interpolation method specified in the methodology (depending on the equipment type: for air-to-water chillers, this refers to the leaving-water temperature; for rooftop units, to the supply-air temperature) as a function of the different outdoor or ambient temperatures. This interpolation can be used to obtain both the power input Pa (Tj) and the unit output capacity Pf (Tj) . The remaining values can then be derived from these two values.
The equation used to calculate SEERON is a summation of capacities at specific temperatures. The temperatures and operating hours required to obtain this value are shown in the following table, also taken from the standard and broken down into the defined bins:
|
Cooling-mode bin j |
Temperature Tj (°C) |
Operating hours Hj (hours) |
|---|---|---|
| 1 | 17 | 205 |
| 2 | 18 | 227 |
| 3 | 19 | 225 |
| 4 | 20 | 225 |
| 5 | 21 | 216 |
| 6 | 22 | 215 |
| 7 | 23 | 218 |
| 8 | 24 | 197 |
| 9 | 25 | 178 |
| 10 | 26 | 158 |
| 11 | 27 | 137 |
| 12 | 28 | 109 |
| 13 | 29 | 88 |
| 14 | 30 | 63 |
| 15 | 31 | 39 |
| 16 | 32 | 31 |
| 17 | 33 | 24 |
| 18 | 34 | 17 |
| 19 | 35 | 13 |
| 20 | 36 | 9 |
| 21 | 37 | 4 |
| 22 | 38 | 3 |
| 23 | 39 | 1 |
| 24 | 40 | 0 |
Heating mode
For heating mode, the procedure is similar; the corresponding seasonal performance metric is SCOP.
As with the SEER calculation in cooling mode, the following diagram shows the SCOP calculation process, with the calculation sequence indicated by the smaller numbers:
SCOP is calculated using the following equations:
The operating-hour tables for heating mode are also standardized and differ from those used for cooling mode. It is therefore important not to confuse them and to use the correct table in each case:
| Heating mode hours |
Avg. (h) |
Colder (hours) |
Warmer (hours) |
|---|---|---|---|
| HCE | 1400 | 2100 | 1400 |
| HTO | 179 | 131 | 755 |
| HSB | 0 | 0 | 0 |
| HCK | 2036 | 1264 | 2414 |
| HOFF | 3851 | 2320 | 5100 |
The remaining terms are defined in the same way as for cooling mode.
The main difference between the two modes is that cooling mode uses a single climate zone and therefore a single set of calculation hours and temperature bins, whereas heating mode can produce three different performance values depending on the climate zone where the equipment will be used: average, warmer and colder.
Heating mode also accounts for a supplementary electric heater. This represents situations in which the available heat-pump capacity is insufficient to meet the required heating load under certain extreme outdoor conditions.
Each bin used in the calculation has a temperature and a corresponding number of operating hours. As in the previous case, the heating-mode data are provided in the following table from the standard:
|
Heating-mode bin J |
Temp. Tj (°C) |
Average-climate hours hj_average (h) |
Colder-climate hours hj_colder (h) |
Warmer-climate hours hj_warmer (h) |
|---|---|---|---|---|
| 4.5 | -26.5 | 0 | 0 | 0 |
| 9 | -22 | 0 | 0 | 1 |
| 10 | -21 | 0 | 0 | 6 |
| 11 | -20 | 0 | 0 | 13 |
| 12 | -19 | 0 | 0 | 17 |
| 13 | -18 | 0 | 0 | 19 |
| 14 | -17 | 0 | 0 | 26 |
| 15 | -16 | 0 | 0 | 39 |
| 16 | -15 | 0 | 0 | 41 |
| 17 | -14 | 0 | 0 | 35 |
| 18 | -13 | 0 | 0 | 52 |
| 19 | -12 | 0 | 0 | 37 |
| 20 | -11 | 0 | 0 | 41 |
| 21 | -10 | 1 | 0 | 43 |
| 22 | -9 | 25 | 0 | 54 |
| 23 | -8 | 23 | 0 | 90 |
| 24 | -7 | 24 | 0 | 125 |
| 25 | -6 | 27 | 0 | 169 |
| 26 | -5 | 68 | 0 | 195 |
| 27 | -4 | 91 | 0 | 278 |
| 28 | -3 | 89 | 0 | 306 |
| 29 | -2 | 165 | 0 | 454 |
| 30 | -1 | 173 | 0 | 385 |
| 31 | 0 | 240 | 0 | 490 |
| 32 | 1 | 280 | 0 | 533 |
| 33 | 2 | 320 | 3 | 380 |
| 34 | 3 | 357 | 22 | 228 |
| 35 | 4 | 356 | 63 | 261 |
| 36 | 5 | 303 | 63 | 279 |
| 37 | 6 | 330 | 175 | 229 |
| 38 | 7 | 326 | 162 | 269 |
| 39 | 8 | 348 | 259 | 233 |
| 40 | 9 | 335 | 360 | 230 |
| 41 | 10 | 315 | 428 | 243 |
| 42 | 11 | 215 | 430 | 191 |
| 43 | 12 | 169 | 503 | 146 |
| 44 | 13 | 151 | 444 | 150 |
| 45 | 14 | 105 | 384 | 97 |
| 46 | 15 | 74 | 294 | 61 |
These operating hours and temperature profiles correspond to standardized reference climate conditions used for seasonal calculations and do not necessarily represent the actual climatic conditions at the equipment installation site.
UNE-EN 14825 provides the procedure for calculating seasonal performance values, thereby producing a better efficiency indicator that can help reduce equipment energy consumption and minimize environmental impact without compromising appropriate thermal-comfort installations, regardless of their eventual application.
Another advantage of calculating these values is that they allow equipment in the same or different ranges to be compared across climate zones, helping select the most efficient unit for the customer’s requirements.
They also make it possible to compare our equipment with equivalent or similar products from other manufacturers and determine how much improvement is possible.
Please contact us with any questions. The KEYTER team will be pleased to address any issues raised by this article. If there is a specific topic you would like us to cover, get in touch with us!

Mari Ángeles Cepillo García
Industrial Technologies Engineer · Energy specialization · Researcher in IAQ and HVAC
University Expert in Air-Conditioning Systems. Engineering Department at KEYTER.
More articles
Interested in other (technical) knowledge articles? Keep yourself up to date and read them all
